

Table of Contents
Abstract
This paper details the hydraulic culvert design for one of the seven culverts needed for a 12 km road in the West Coast region of New Zealand’s South Island, connecting Milford Sound to Liawrenny Peaks. Because the area’s terrain is difficult and rainfall is abundant, the structure must have excellent drainage systems. It includes a catchment analysis, an estimate of peak discharge and the sizing of culverts according to both control conditions at the inlet and outlet. The calculations are supported by hydrology data and various charts that come from HIRDS.
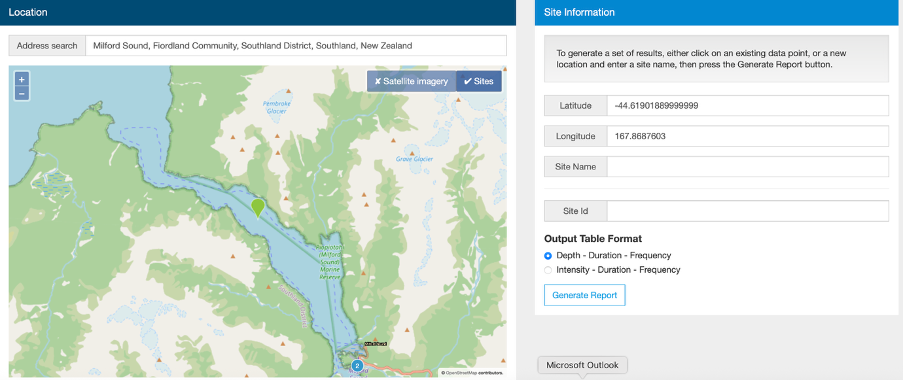
Project Location: Milford Sound
Latitude: -44.6190189
Longitude: 167.8687603
Introduction
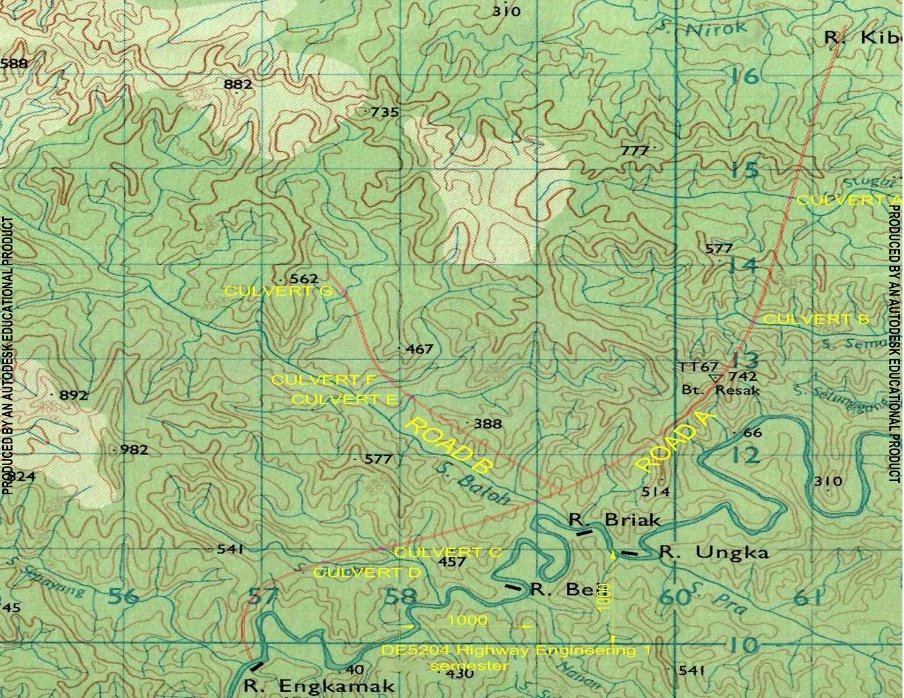
It has been planned that a new rural road will run from Milford Sound to Liaw Renny Peaks along the West Coast of the South Island of New Zealand, a distance of around 12 kilometers. As is shown in Figure 1, the roadways proposed, referred to earlier as A and B, will pass through rough land that receives a lot of rain. During the trip, the roads will cross numerous streams. Being part of the engineering team, you need to perform the hydraulic design for one of the seven culverts described in the project appendix. You should also review the list of variable design parameters related to the project to finalize your task.
Objective
- The selection of a culvert’s contributing catchment area is done with the help of AutoCAD tools.
- Key points such as the size, main channel path, average slope and water concentration time should be identified next.
- To calculate the design rainfall intensity, use the NIWA HIRDS online tool choosing the annual return interval given to you.
- Using the Rational Method, to determine what the culvert’s peak discharge would be.
- To properly pick and design a culvert system (single, twin or triple) from the available pipe sizes and design charts.
- This part of the experiment looks into a circuit’s hydraulic performance under both types of control and determines which is most influential.
- To determine how fast the water moves in each outlet and whether a hydraulic jump can develop and then provide suitable measures for energy dissipation when needed.steps if required.
Methodology
Catchment Analysis procedure: Boundary Delineation
- Accessed the AutoCAD file that was given to me.
- Determined the area where the water comes from to reach the specific culvert.
- Outlined the boundary using the Polyline tool.
- Utilized the Area command in Tools/Inquiry to identify the area in hectares.
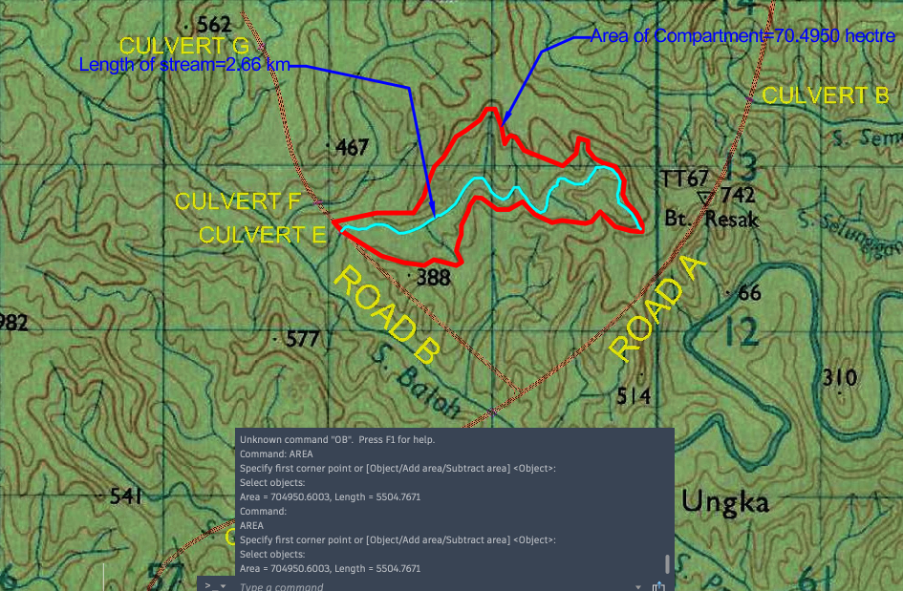
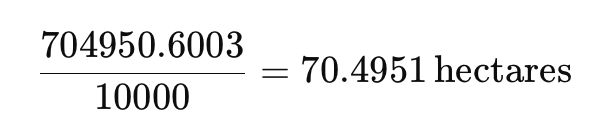
Area of compartment= 70.4951 hectares
Rainfall Intensity: Longest Stream Length Measurement
The website hirds.niwa.co.nz provides the data for the 10-year ARI rainfall intensity at Milford Sound. A printout of the chosen data can be found in the appendix.
- Selected the stream that has the most amount of distance from where it begins to where it ends in the catchment.
- A Polyline was used in AutoCAD to follow the stream on the map.
- Measured the length using the List command and wrote it down in kilometers.
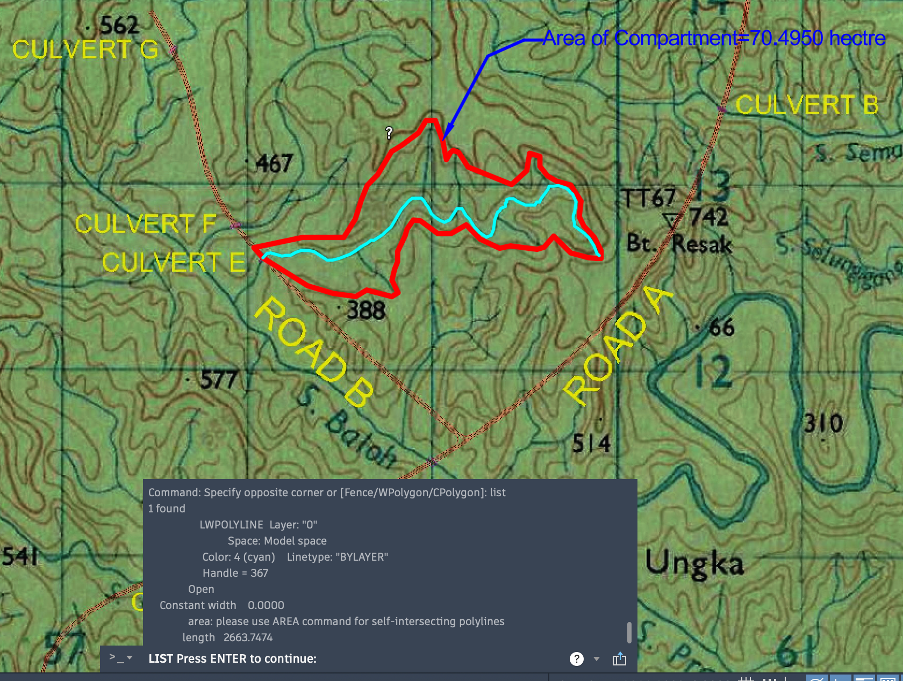
Length of Stream = 2.6637 km
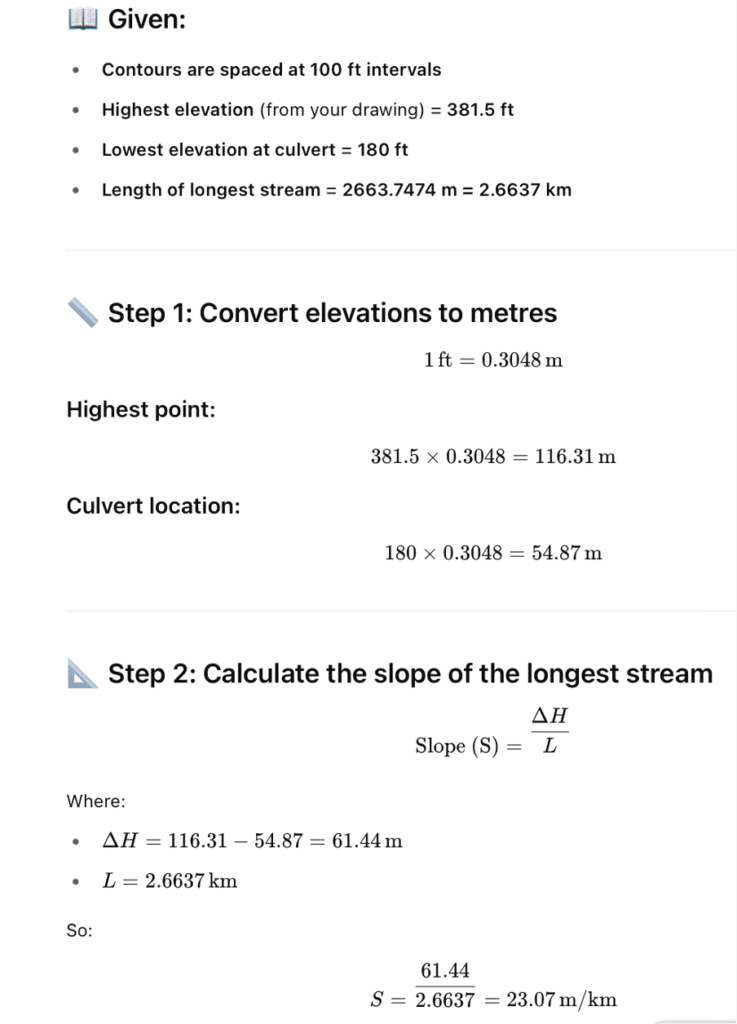
Slope of longest stream
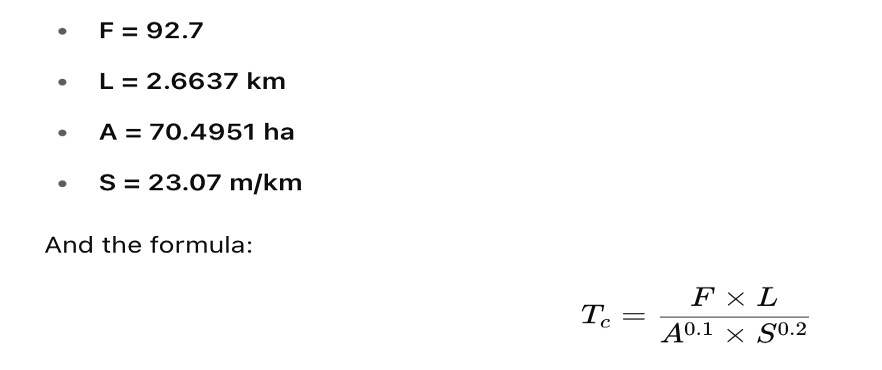
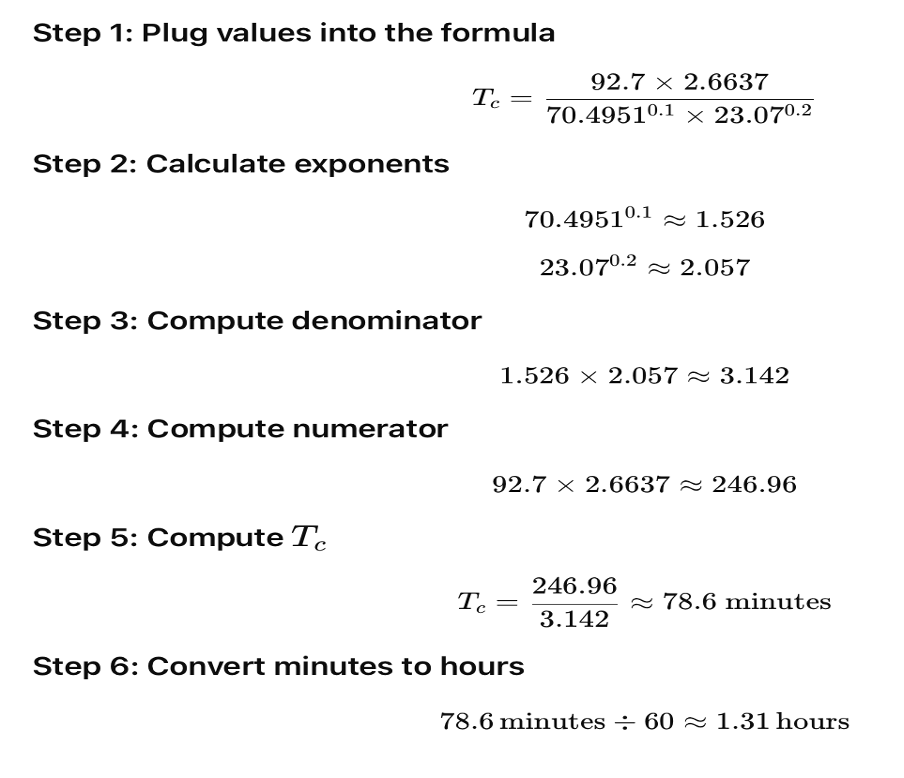
Peak Discharge Estimation(Q)
Using Bransby-Williams (1977) formula.
Rainfall Density(mm)
- The NIWA HIRDS website is available at this link. https://hirds.niwa.co.nz
- Go to Input Location and add “Milford Sound.”
- Pick a Duration: An hour (60 minutes) is enough if this is how much time you can concentrate for.
- Choose ARI: Set the interval for average recurrences to 10 years.
- Use the tool: After entering your inputs, the rainfall intensity will appear.
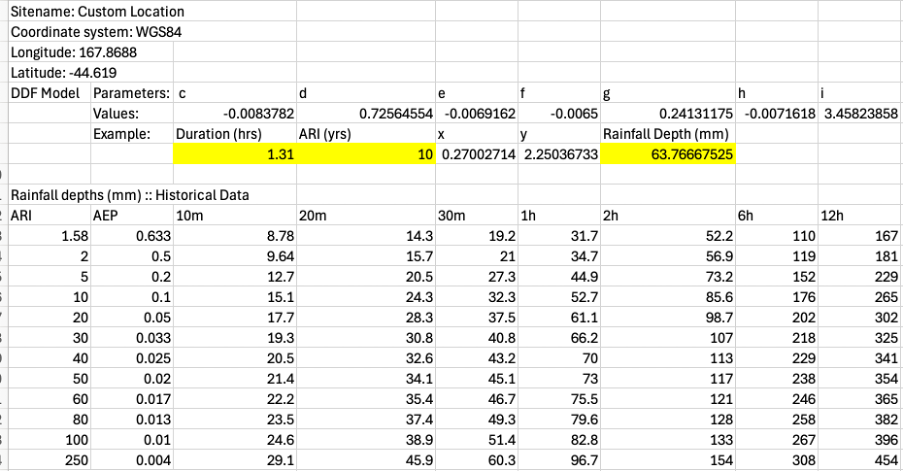
Rainfall intensity(i) = 63.76 mm/hr
Peak discharge Qp (m3/s)

Culvert Hydraulic Design
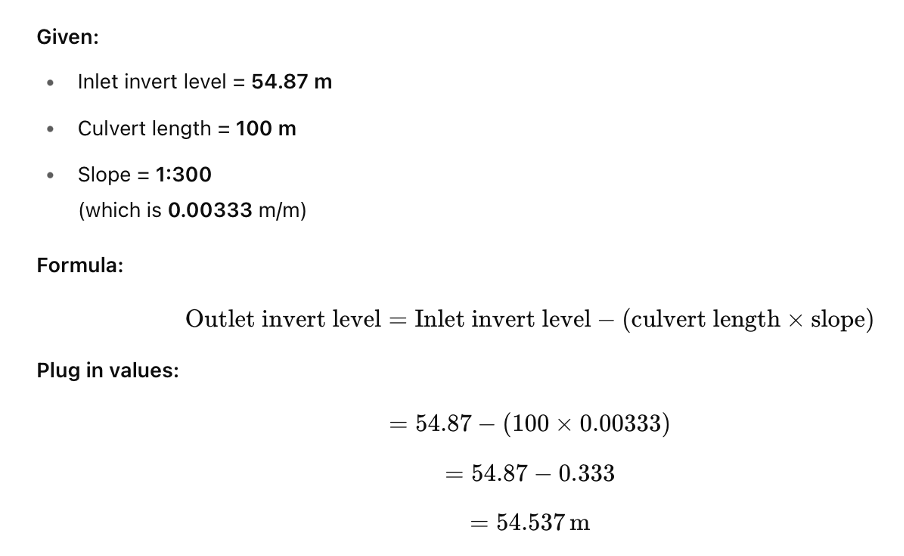
You can get culverts in diameters of 1200 mm, 1500 mm and 1800 mm. A part of the culvert is 100 m long and slopes at a 1:300 ratio.
Determine the outlet invert level of your culvert
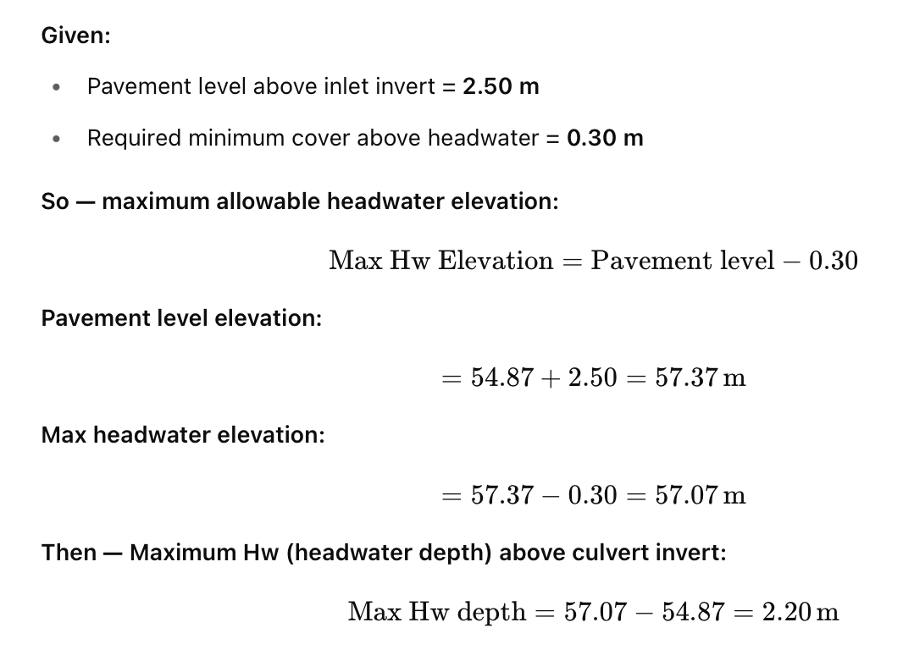
Determine the maximum Headwater (Hw) at the inlet of your culvert
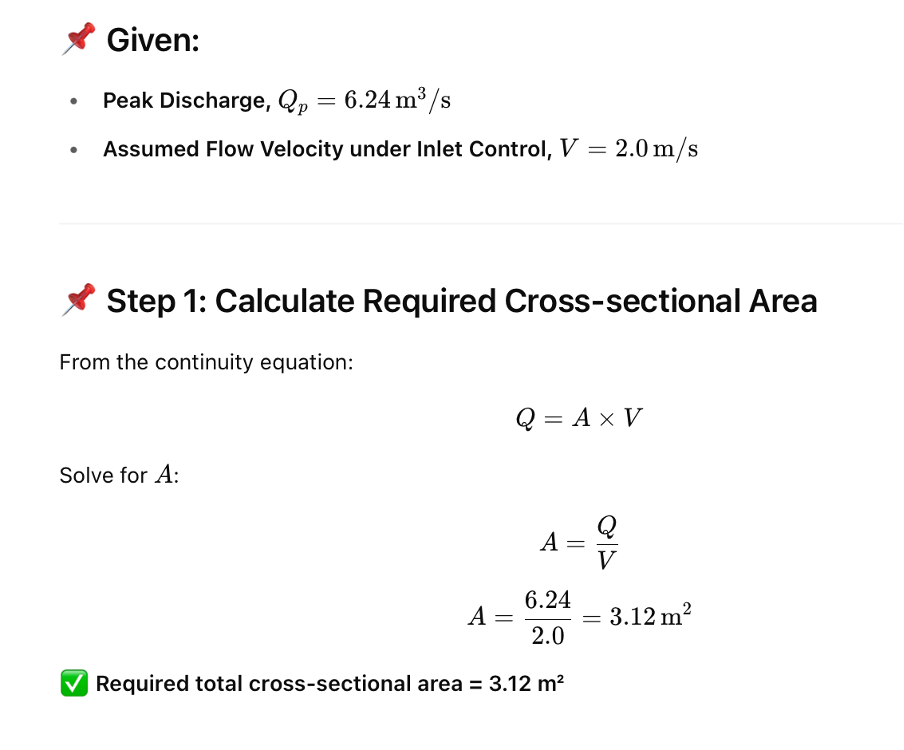
Culvert Design Calculations — Inlet Control Assumption

Final Recommendation
Best fit hydraulically: 2 × 1200 mm culverts
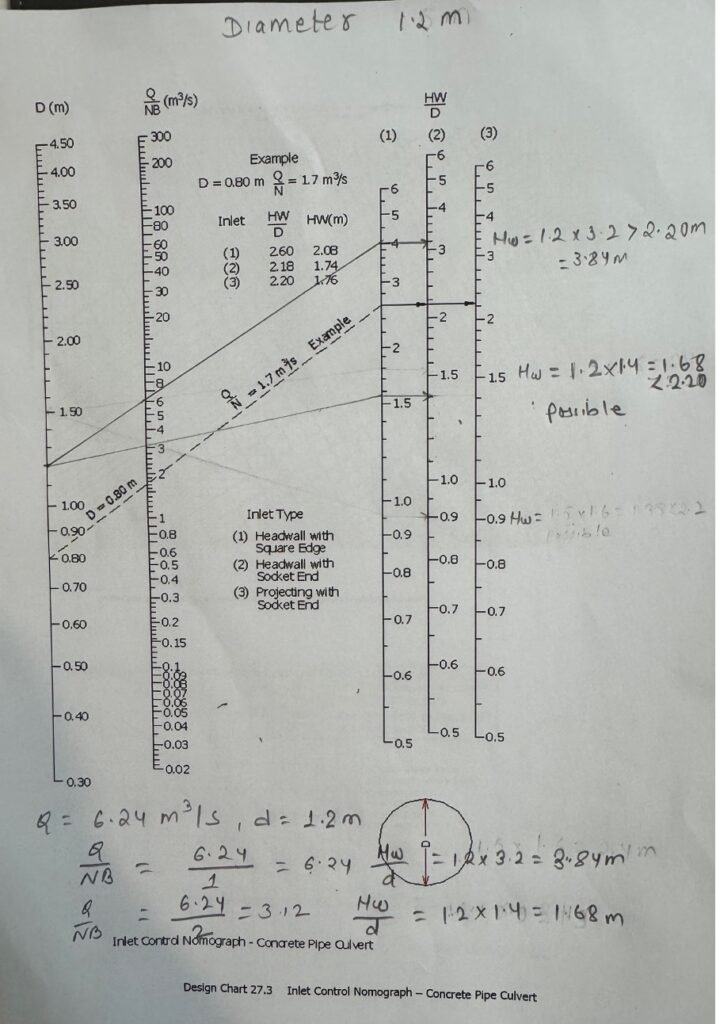
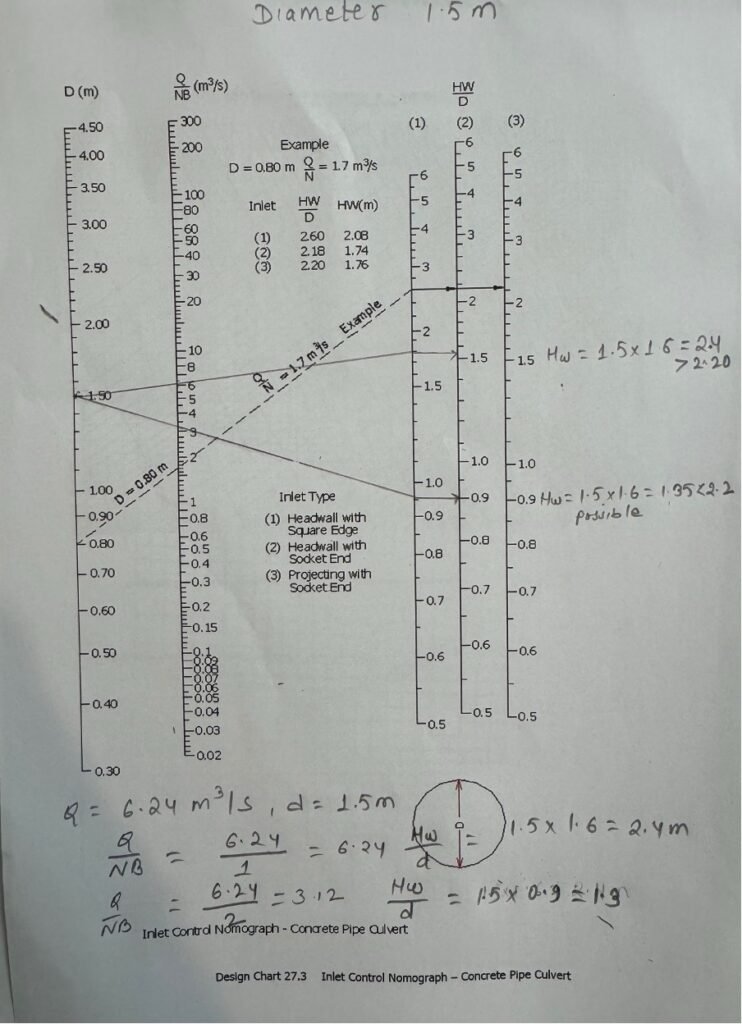
c) Solution Using an Inlet Control
Since I was in control of the inlet, I determined the size of section needed by the given flow velocity. When choosing the right culvert size and amount, Design Chart 27.3 was consulted.
d) Outlet Control Check
The headwater under outlet control was estimated using:
Hw = H + ho − LS
The results from the inlet control are used to compare and determine the correct control. I consulted Design Charts 27.8 and 27.10 for my calculations.
e) Outlet Velocity and Hydraulic Jump
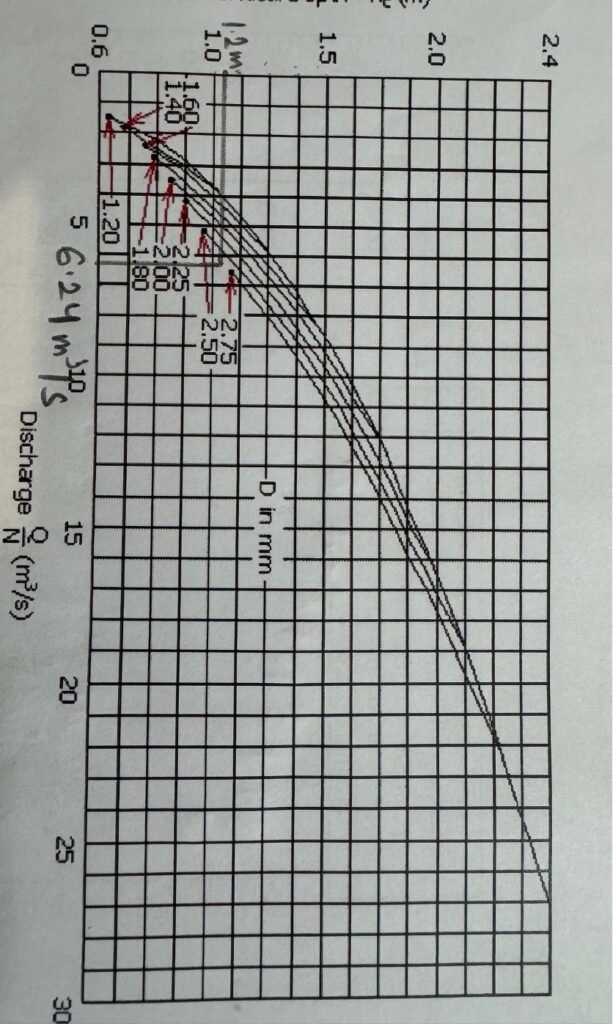
A calculation was performed to see if the outlet velocity was high enough for hydraulic jump to develop. In some areas, it was recommended to install riprap aprons, energy dissipators and stilling basins. Colebrook-White developed a chart that was used for measurements in mm.
Conclusion
This project successfully carried out the hydraulic design for a culvert system on a proposed rural road linking Milford Sound to Liawrenny Peaks, located in one of New Zealand’s highest rainfall regions. The contributing catchment area was carefully measured using AutoCAD and was found to be 70.4951 hectares with a longest stream length of 2.6637 km and an average slope of 23.07 m/km.
By using the NIWA HIRDS tool to find data, we applied 63.76mm/hour ARI rainfall to the Rational Method and measured a peak flow rate of 6.24 m³/s. The problem stated inlet conditions are used for culvert selection, so accordingly, Design Chart 27.3 led to the suggestion of 2 × 1200 mm diameter culverts.
Estimates of grip height were taken from the graduated culverts and the highest depth that could be safely tolerated at headwater was found when the system was modeled both with and without outlets. Different culvert configurations were tested and their outlet velocities were measured. To evaluate Froude number risk, hydraulic jumps were evaluated. Because the outlet velocities were less than the critical threshold for the recommended setting, hydraulic jumps were greatly reduced. In places where the gradient or velocity was higher, it was advised to use riprap aprons, stilling basins or outlet control structures to control energy in the water.
Using the Colebrook-White chart with a roughness value of 0.60 mm, the correct frictional losses were predicted and the culvert construction confirmed suitable for dealing with the local hydrological and land conditions.
The project stresses that linking topographic research, information from hydrological studies and standard hydraulic guidelines equips drainage work to be safe, efficient and able to cope with different conditions for remote locations.
References
- Bransby-Williams, W.R. (1977). Hydraulic formulae for the estimation of peak flows in small catchments. CIRIA Report 124, London.
- National Institute of Water and Atmospheric Research (NIWA). (2024). High Intensity Rainfall Design System(HIRDS) V4. Retrieved from: https://hirds.niwa.co.nz
- Ministry of Works and Development, New Zealand. (1980). Culvert Design Charts. NZMWD, Wellington.
- Colebrook, C.F., & White, C.M. (1937). Experiments with fluid friction in roughened pipes. Proceedings of the Royal Society of London, Series A, Mathematical and Physical Sciences, 161(906), 367–381.
- Austroads (2013). Guide to Road Design Part 5A: Drainage – Road Surface, Subsurface and Culverts. Austroads Ltd, Sydney.
Latest assignment on Liquid limit test geotechnical engineering – 2025
Free college assignment about STANDARD PENETRATION TEST – 2025
Latest assignment on Longitudinal Section, Sketch the Mass Haul Diagram report – 2025 project
Free college assignment about STANDARD PENETRATION TEST – 2025